Tag Archives: Infographics

19 Things About Star Wars

14 Sep

Never has a movie franchise affected popular culture as much as Star Wars has ours. George Lucas managed to not only create a movie, but created a whole new universe with its own history, which resulted in more fan involvement than any other movie franchise in history. Although I was not born until about 30 years after the first Star Wars was released, when I saw it it was as though it had just been released. Star Wars has managed to keep its steam throughout all these years and generation after generation continues to watch it.

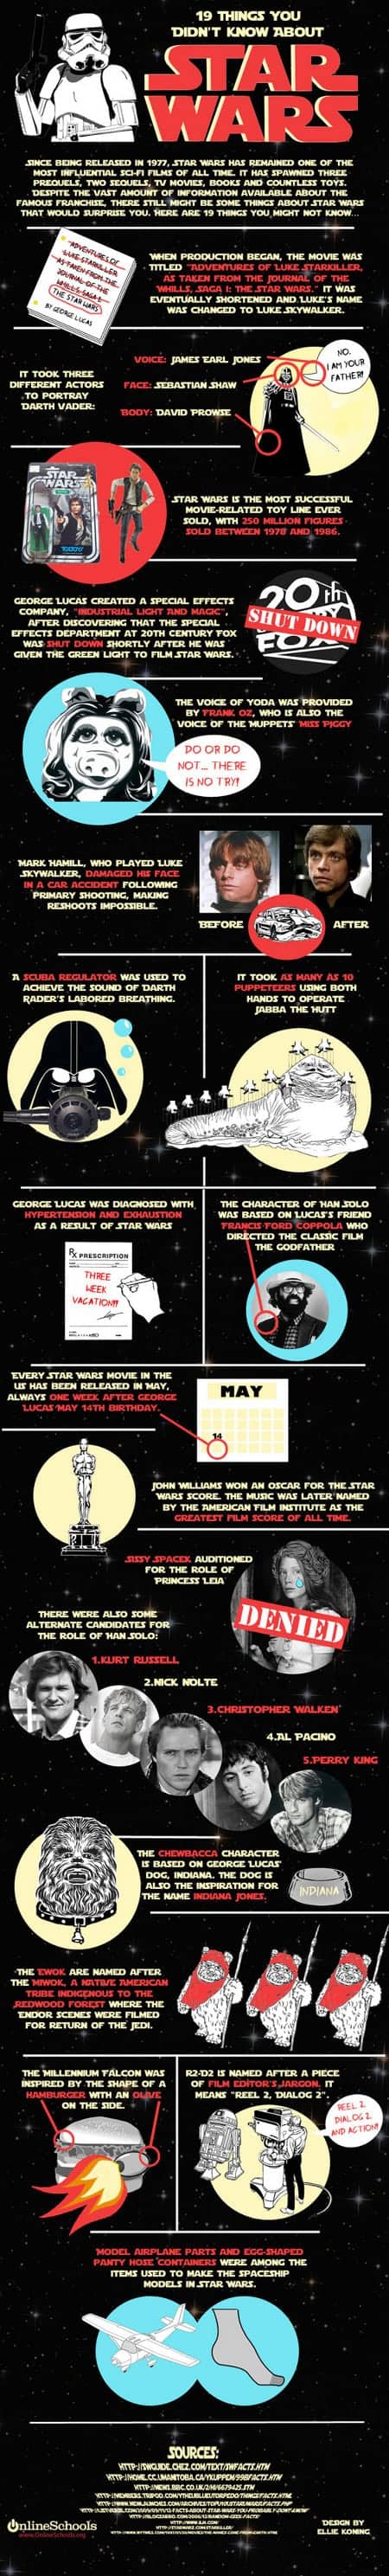
Today’s infographic provides us with an up and down layout providing 19 different little known facts about Star Wars. As many of you may already know, James Earl Jones provided the voice for Darth Vader and Sebastian Shaw provided his face. However, did you know that there was a third actor involved in the creation of Darth Vader? David Prowse provided the massive body for the character. Another fun fact, the Ewoks were in fact named after the Native American tribe, Miwok, who lived in the Redwood forest in which the Endor scenes were filmed.

Source.

Taxonomy of Rap Names

4 Sep

If you’ve been kept up at night wondering how Uncle Murder Murda got his name, this handy chart will help you sleep better. Presenting: The Grand Taxonomy of Rap Names. Check out the much grander image.

Source.

Can Facebook Affect Your College Admission?

15 Aug

As everyone knows Facebook is virtually in everything these days, even making it’s way into college admissions. In fact 80% of America’s top colleges are using social media as a form of recruitment. No longer is it simply the achievements you have received in high school that are looked at by colleges, but your Facebook profile is as well. Universities state that the Facebook profile is in a medium to high range of priority in evaluating a candidate for their school.

Source.

Infographic – Is There Alien Life Out There… on Earth?

22 Jul

Forget about extraterrestrial life out there in the universe. What about here on Earth? Here’s a look at what people in different countries believe about the possibility of aliens walking among us.

A collaboration between GOOD and Column Five Media.

Source.

https://i0.wp.com/awesome.good.is.s3.amazonaws.com/transparency/web/1107/space-invaders/transparency.jpg

Evolution of the Hipster

18 Jul

…not sure how factual this infographic is. I’m pretty sure I’ve seen somebody dressed like these people all in the last week, not in the last 10 years.

Source.

How Music Taste is Inherited

6 Jul

As people grow into their refined music tastes, moving from top 40 hits to alternative rock stations and beyond, one might wonder how they formed their preferences. Maybe your parents blasting old records had more of an influence than you once thought. Because STYX, Alice Cooper and Pink Floyd aren’t included, my music taste is untraceable, but maybe this infographic will ring true to you.

Source.

The Music Industry and Online Piracy

6 Jul

We are all Pirates. Do not deny it. Every time you give a burned CD to a friend, put music on a flash drive, ask your kids to download you a CD, lend out your external, or download from the web you’re “stealing.” We are very nice pirates though. We don’t keep everything to ourselves, we share our booty with the world.

Sure, the music industry sucks. They’d rather sue people for absurd amounts than change their business model. That isn’t entirely true.  The big labels are changing how they make money, but with a such big corporations it takes a long time. Just think of all the lawsuits filed as the only way the record labels can fend off illegal downloading until they have a more diversified business plan. I’m not going to say basing your whole business on one source of income (album sales) was a smart thing in the first place. That was a horrible idea, but now they are paying the price.

I also hate that the industry whines all the time about how no one buys music any more and they blame it entirely on internet pirates. Look at where we spend our money in the entertainment industry now a days, video games. If someone buys 6 video games a year that is 360 dollars not spent on music. It isn’t like people suddenly have so much money that they can afford all forms of entertainment and keep spending as much money on music as they like.

Source.

The Reality Behind Social Location Apps

22 Jun

Digital services company Beyond compiled the results of their research into location-based apps, and designed this infographic summarizing the results; Check-In Data: The Reality Behind the Hype.  Released in conjuction with the Social-Loco conference in San Francisco, CA on May 5th.

As part of our involvement in the Social-Loco conference we have done some research to try to understand the difference between what people are saying online compared to the actions of early adopters and the views of the rest of the US population when it comes to their mobile check-in habits.

The results give us a clear understanding of who the winners and losers are likely to be, as well as the types of things that will motivate the mass consumer to adopt location-based apps. They also highlight some of the real challenges there are to consumers embracing this technology.

The data is very interesting.  Personally, I continue to use Foursquare, but find myself checking in less and less because I don’t get any direct benefits out of it.

From a design standpoint, I like the circle clusters, but I don’t like data separate in a legend on the side.  I appreciate that the color-coding remains the same, so Twitter is the same color in each visualization.  I would have included the logo images for the social location-based apps, and connected the data directly to the circles.  Data legends like this make your readers work harder to understand the information.

I also think that the most interesting learning from the study is the comparison between how people interact with national brands and small, local businesses.  However, this is the last visualization at the bottom, and gets lost.

Source.

Foursquare Reaches 10 Million Users

22 Jun

Foursquare yesterday announced that they have reached 10 Million members, and released this infographic for the occasion.

And, to commemorate this pretty crazy occasion, we put together a little infographic. Be sure to click through to see it bigger; if you’re anything like us, watching the full-size animated map puts butterflies in your tummy. Thank you so much for supporting us!

I love the animated portion right in the middle!

Personally, I have mostly given up on Foursquare check-ins without the points or mayorships earning anything for me.  I wonder how many of those 10 Miliion joined, but don’t use Foursquare anymore?


Source.

Just how dangerous is sitting all day?

24 May

Sitting down, which most of us do for at least eight hours each day, might be the worst thing we do for our health all day.

We’ve been preaching the benefits of stand-up desks for a while around here — and no one needs this good news more than social media-obsessed web geeks. A recent medical journal study showed that people who sit for most of their day are 54% more likely to die of a heart attack…

Source.